Spoiler alert: the most valuable Agile metrics are lead time and flow efficiency.
First off, what is lead time?
Lead time is the amount of time between the initiation of committed work to its completion. For example, if you start working on a task on March 2nd and finish it on March 5th, the lead time of that task would be 4 days.
There are different points in your delivery pipeline where you measure lead time. Per Kanban University terminology, system lead time is the amount of time it takes to complete work from the commitment point to the first unbounded queue. Customer lead time begins at the point of commitment to when the customer receives their order.
Why you should care about lead time
Decreasing lead time is vital to success. A shorter lead time means lower costs. The less amount of time an organization spends fulfilling a customer request, the less it costs them. Additionally, the shorter your lead time, the more quickly you’ll get feedback and/or revenue. It also makes for happier customers! As Taiichi Ohno said after he retired from Toyota, “All we are doing is looking at the timeline from the moment the customer gives us an order to the point when we collect the cash.”
Using lead time for estimation
While knowing the lead time of a single completed work item is handy, the real magic happens when you gather enough lead time data about your system to calculate your “most likely” lead times. This gives you real data you can use for estimation and forecasting. Imagine not having to estimate each work item individually and all the extra time you will free up for value creation!
Suppose you work in a puppet factory that specializes in making custom puppets. Every customer wants to know how long it will take their order to get filled and how much it will cost before they sign the contract. You can use lead time data to provide them this information!
Step 1: Determine the lead time for each delivered order by subtracting the date it was completed from the day it was started. Note, if your work has a shorter delivery timeframe, you can use hours instead of days. If longer, you could use months.
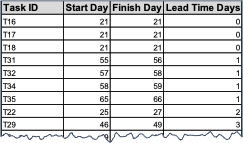
Step 2: Next, figure out the lead time in the 85th percentile. I recommend using your spreadsheet software’s percentile formula (PERCENTILE.INC(D9:D43,0.85)). The answer is 16 days. So, 85% of our orders took us 16 days or less to complete! Now we can give our customers a reliable estimate.
What is flow efficiency?
Flow efficiency is the percentage of time work items were actively worked on, compared to the time they spent waiting. The formula for flow efficiency is (time spent actively working on item/lead time)x100
For example, let’s say our puppet shop gets a complicated order from a customer that requires multiple hand-offs between our company and several external vendors. After the order is fulfilled, you wonder how efficient your process was for this type of order.
When you look at the data from start to finish, the order took three months to fulfill. Next, you look at how much of that three months (480 hours) was spent actively working on these special puppets: 12 hours. (12 hours /480 hours)x100
The flow efficiency of this order? A mere 2.5%. Meaning more than 90% of the total lead time was spent on non-value-add activities (i.e. waiting).
Flow efficiency provides a compelling visualization of your actual efficiency. The lower your flow efficiency percent, the more time and money you are tying up in undelivered inventory. Until you deliver, you 1) won’t receive any money, 2) won’t be certain if the product meets your customer’s needs, 3) spend time tracking and following up on waiting work instead of creating value, and 4) displease your customers
Flow efficiency is a simple metric to track, and measuring it will help you:
- Know whether you are improving or not
- Recognize how much time goes to waste waiting on something
- Understand where your process needs adjusting
Remember, only use metrics for good
When I teach Agile metrics, I feel obligated to give a disclaimer. The right tool in the wrong hands can be dangerous. For example, imagine a guy named Larry. Larry really loves toast and really loves taking baths. One day, Larry decides to combine his two favorite passions and brings his toaster into his bathtub. Toasters are wonderful devices. They bring joy to people through the form of browned, crisped bread products. However, when toasters are used in not good ways, the results can be disastrous (RIP Larry).
Like toasters, business metrics can be a wonderful tool. When used in the right hands, metrics enable businesses to make good decisions based on objective data. As Peter Drucker, business philosopher, said, “If you can’t measure it, you can’t improve it.” In response, I say, “amen, Peter. “
However, when metrics are used in the wrong hands or used for the wrong reasons, the business results can be disastrous. If you use lead time and flow efficiency to quantify worker productivity not only will the metrics become useless, but you will engender a culture of distrust, and incentivize the wrong actions. The perfect one-two punch to paralyze productivity.
To learn more about using Agile and its metrics to improve your productivity and keep your customers happy, join one of NextUp’s upcoming courses.